The Gold Bear and Dollar Bull
Gold is down, the dollar is up measured in gold, and rising interest rates sit under both.

This week is one thread pulled through three different views. Gold is in a bear market that almost nobody is naming. Housing is in a bear market that everyone is feeling. And rising interest rates sit under both of them.
In this issue:
- The bear market nobody is naming
- 2011 is the map
- The rate that sets the price of everything else
- Who is buying gold, then and now
- What the model says this month
- Links worth your time
The Bear Market Nobody is Naming
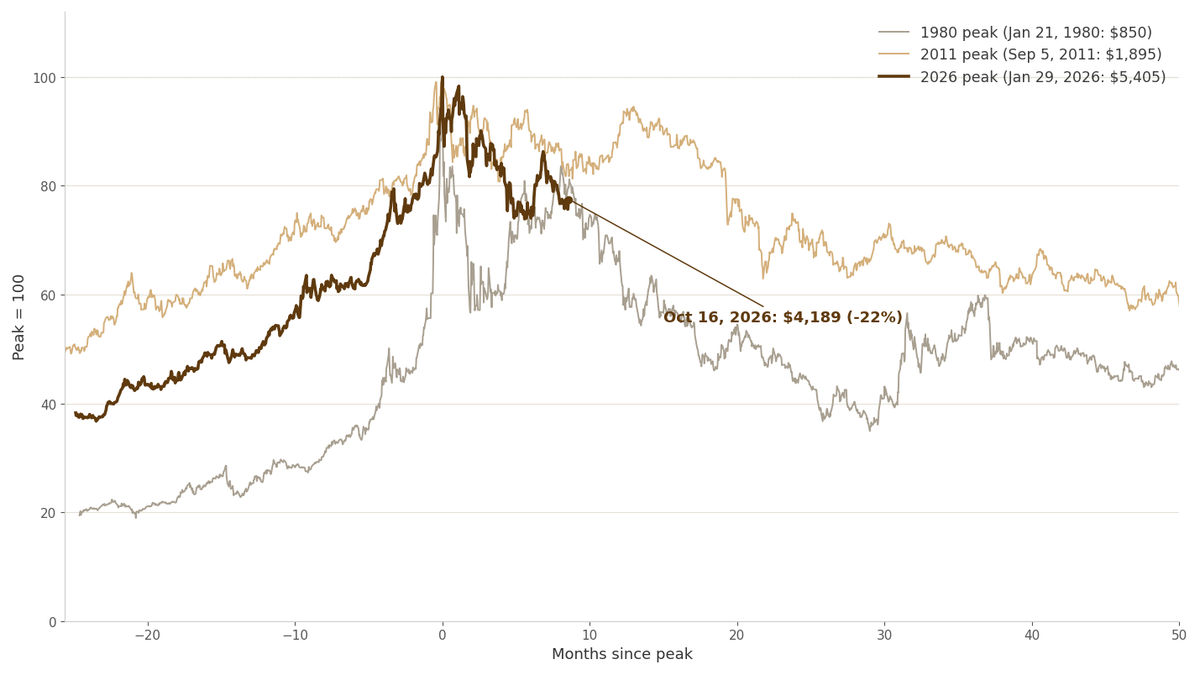
Gold is down roughly 22% from its peak, measured on the LBMA PM fix: $5,405 on January 29, 2026 to $4,189 on October 16 (source: LBMA via the World Gold Council). One detail the headlines keep getting wrong: the peak was late January, not February. But flip the chart over: priced in gold, the dollar is up 29%, further ahead than it was at the same point after the 1980 and 2011 peaks. Everyone sees a gold bear. Almost nobody names the other side of it: a dollar bull that is only visible through gold.
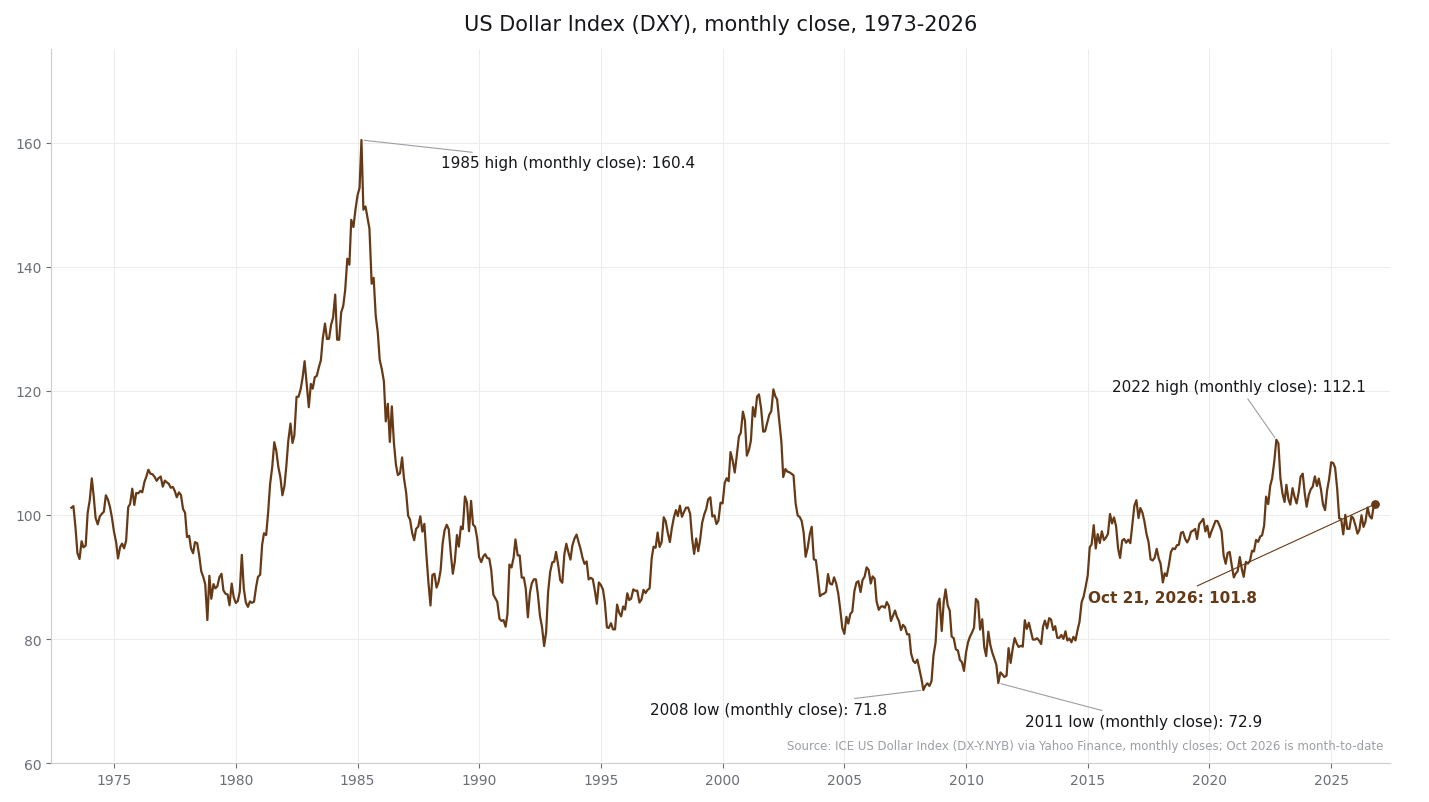
The proper frame is that the USD is near-term oversold, the same setup as 1980 and 2011, and the DXY is on a strong uptrend going back to 2010. Meaning the dollar is due for some strength and gold is due for further correction with it.
What would prove this wrong: gold rallies while real yields fall. Last week the 10-year TIPS yield fell 17bp to 2.74% (Oct 9 to Oct 16) and gold did not respond. When falling real yields can't lift gold, the bear is still in charge.
2011 is The Map
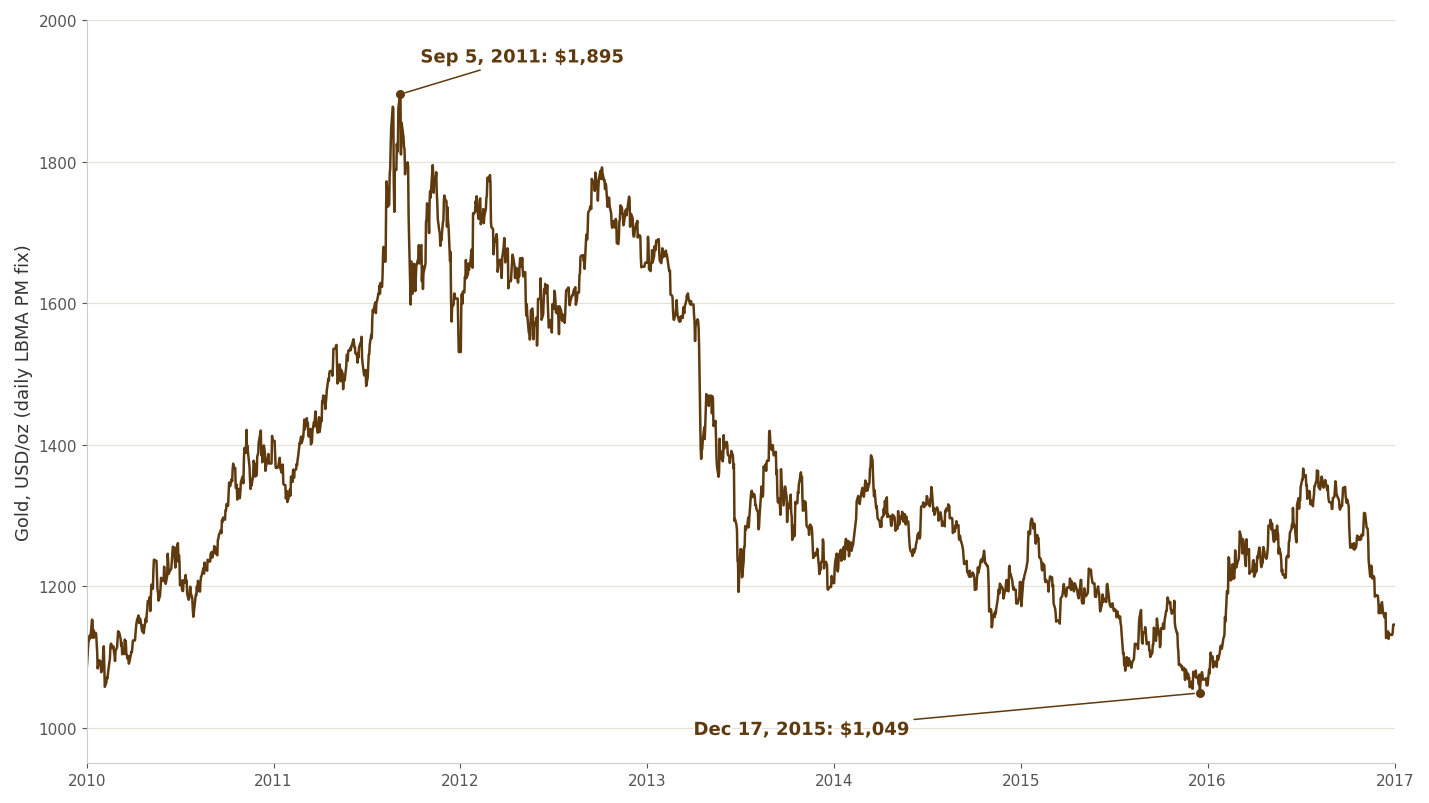
In September 2011, the US dollar was the most oversold it had ever been. One dollar bought 0.00053 ounces of gold. Then the dollar rallied for four years straight. By December 2015 one dollar bought 0.00095 ounces, an 80% gain priced in gold. Everyone called it a gold bear market. Price it the other way around and it was a dollar bull market that nobody named. When a currency gets that oversold against real money, the snapback takes years, not months.
Now overlay this bear on the two before it, 1980 and 2011, each indexed to 100 at its peak. Eight and a half months after the January 29 peak, gold sits at 78, against 80 and 84 at the same point in the earlier bears. Flip it over and the dollar in gold is at 129, against 126 and 120 at the same point. This bear is tracking slightly ahead of the two everyone remembers.
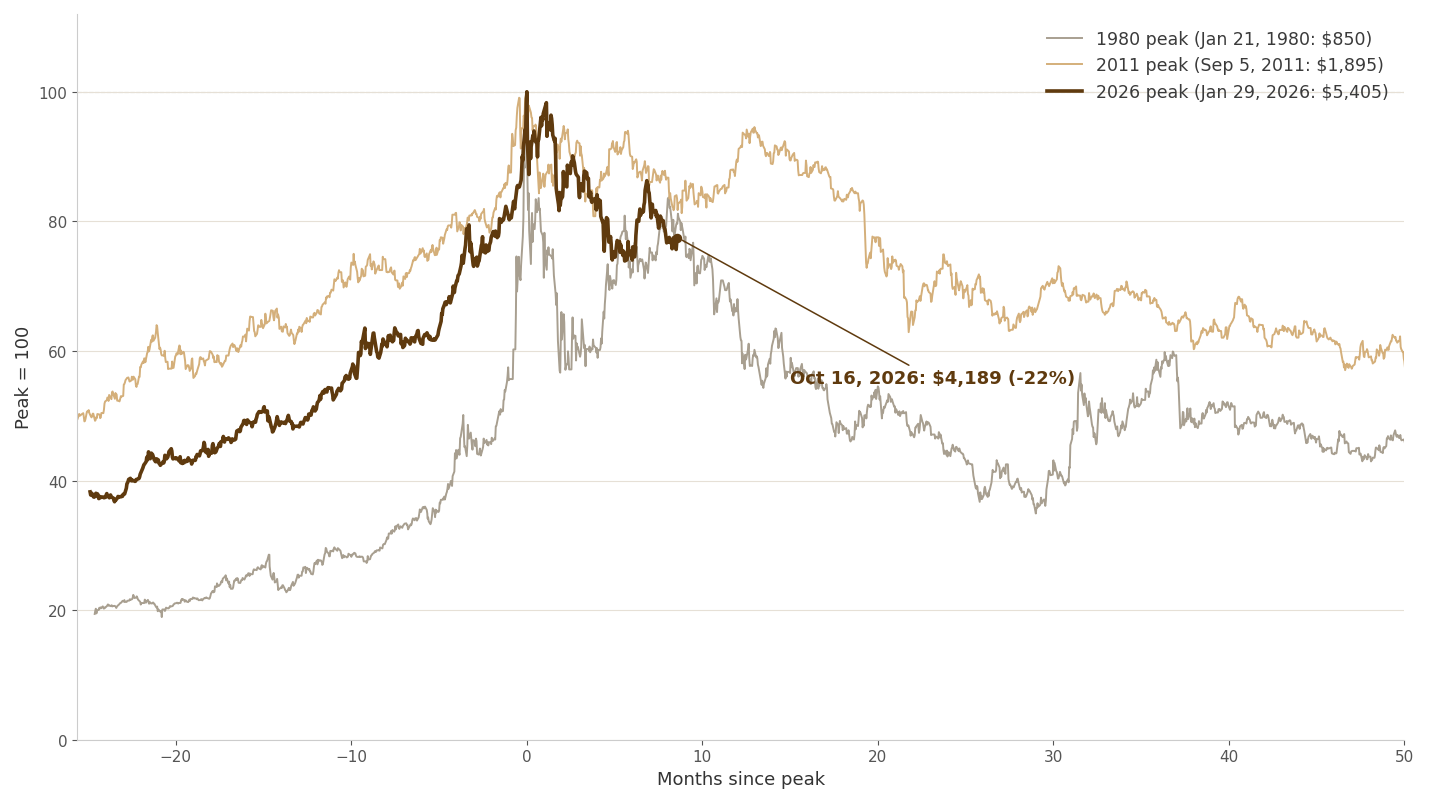
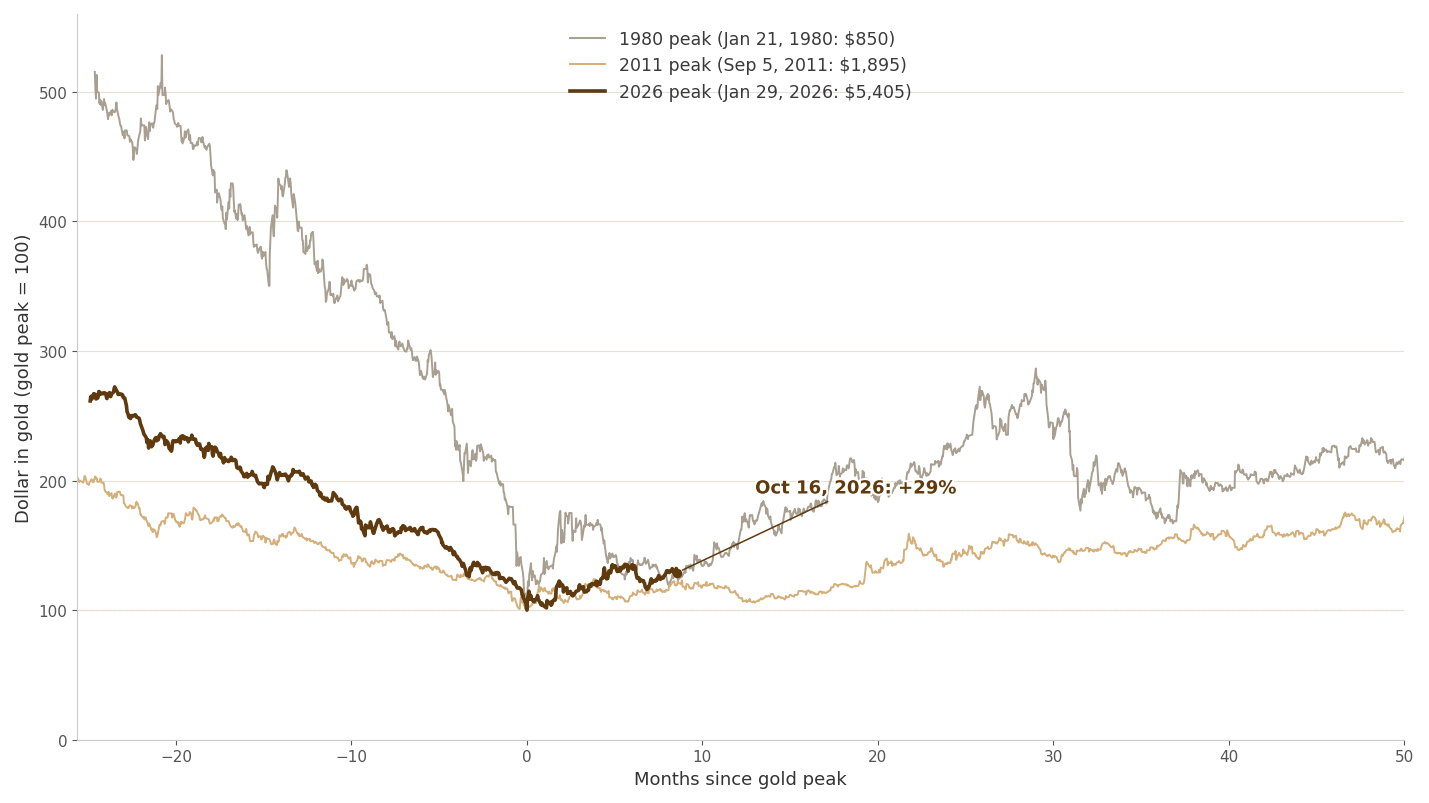
The dollar has been rallying in gold terms for eight and a half months now. If 2011 is the map, it is early.
The Rate That Sets the Price of Everything Else
The 10-year Treasury rose to 5.15% (Oct 19 close). That one number sets the price of everything else. Housing can't refinance out of it, and the same number sits under the gold bear. One thread, two bears.
And zoom out: as long as rates hold above 3%, there is still a lot of pain coming for anything levered. Housing is just the biggest thing on the list.
What would prove this wrong: housing stabilizes with the 10-year above 5%, or gold rallies while real yields rise.
Who is Buying Gold, Then and Now
Before the Nixon Shock, the dominant buyers of gold were foreign central banks. France under de Gaulle, Switzerland, West Germany, Britain and the Netherlands redeemed dollars for US gold at $35 an ounce, until the London Gold Pool collapsed in 1968 and Nixon closed the window on August 15, 1971. The spike that followed, from $35 to $850 by January 1980, was mostly private demand: inflation fears, a weak dollar, two oil shocks. Americans couldn't even legally own gold until the end of 1974. And once the spike was done, the official sector stepped back. The IMF and the US Treasury sold gold through the late 70s, and European central banks were net sellers for most of the 1990s.
This cycle looks different. Central banks have bought over 1,000 tonnes a year from 2022 through 2024, and another 863 tonnes in 2025, roughly double the 2010-2021 average of about 473 tonnes. Poland has been the largest reported buyer two years running, adding 102 tonnes in 2025, and has approved a plan to buy 150 tonnes more. China keeps adding, and its reported numbers likely understate actual buying. India, Uzbekistan, Kazakhstan and the Czech Republic are buying too. Private demand is running alongside: 2025 saw record total investment demand, the strongest gold ETF inflows on record, and bar and coin demand at a 12-year high, while jewelry volumes fell at record prices. In the World Gold Council's 2026 survey, 45% of central banks expect to increase their gold holdings, and 89% expect global official reserves to rise.
In the 1970s the official sector sold into strength and private buyers made the top. This time it is both central banks and investor demand buying the top. If reported central bank buying falls back to the old ~473-tonne average or below for a few quarters while ETF holdings shrink. Then this starts to look like the late 70s after all.
October Prices in Gold
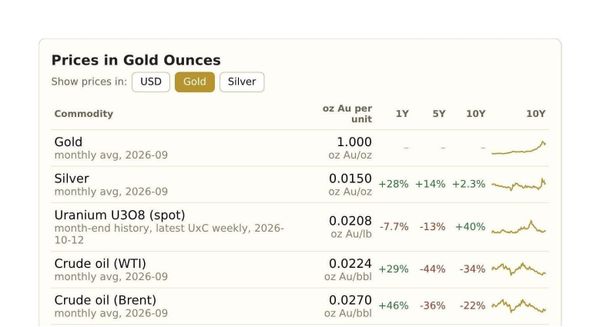
Measured in gold, almost everything is cheaper than it was five years ago. The short version: gold has outrun financial assets and housing, while energy is where real prices are being rebuilt.
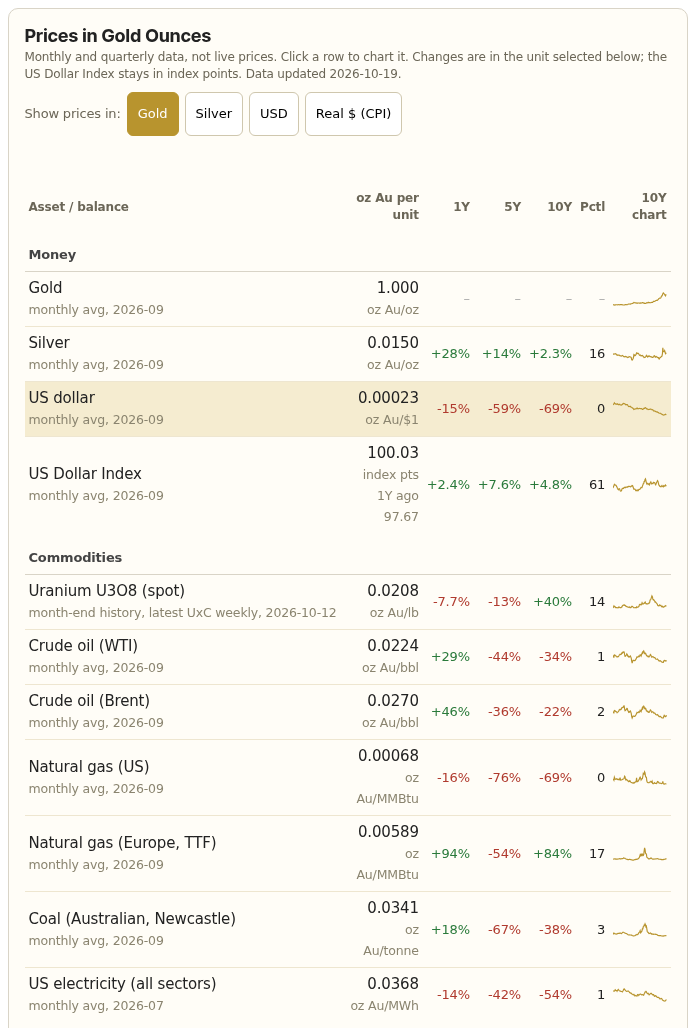
- The S&P 500 is down 29% in gold over five years
- The Dow is down 38%
- Median home prices are down 55%
- Wages are down 49%
- Federal debt is down 46% in gold over ten years
Energy is the exception. Oil is up 29% in gold over the past year. European gas is up 94%, even as US gas is down 16%. Silver is up 28% against gold in a year. Uranium is the one resource up 40% over ten years, though it is down 8% this year. And through all of it, the DXY is in a long-term uptrend.
If you already invest, use the model as a check against your assumptions.
Links worth your time
Here are a few links that I found particularly interesting this week:
- Problems at Dream Finders Homes (The Bear Cave) - An MLB owner borrowed against his homebuilder's stock, and the homebuilder is buying a rival with 12% preferred stock and expensive debt while mortgage rates soar. The levered-housing story in one company.
- Russian Oil & Gas Monthly, July 2026 (Ronald P. Smith) - The Russian fuel crisis peaked and eased, diesel exports were banned, Black Sea exports were impaired for a week, China pressed on gas prices, and Russian LNG started going directly to Asia.
- The Butcher of Wallstreet on X - Robinhood's tokenized stocks are not a 1:1 reserve situation, surprise?
- TheDebriefing17 on the Treasury #1 - When Bessent said "I am the house," he wasn't bluffing about the long end. He was telling you where he plans to win, the short end.
- TheDebriefing17 on the Treasury #2 - Two months ago the Treasury launched what it calls Operation Economic Outcast, nicknamed "Economic D-Day." The stated goal is to cut off Iran's remaining economic lifelines.
- Felder on puts at All Time High - And they love options. From The Wall Street Journal: “Volumes in options tied to individual stocks have recently reached levels seen during the meme-stock mania of 2021, about $700 billion of notional volume a day… The prices of call options, which give the right to buy, have eclipsed levels seen during that time.”
This week's quote: "If I had a nickel for every time we thought the dollar was finished, I would have a bunch of nickels! Indeed, in hindsight, the dollar didn't hyperinflate and most of the world kept using it as a reserve." - FOA, The Gold Trail.
Nothing here is investment advice. It is one investor's framework, shared so you can test your own.
If you have questions, disagreements, or better data, then reply to this email, I read everything.