The Gold Oil Ratio

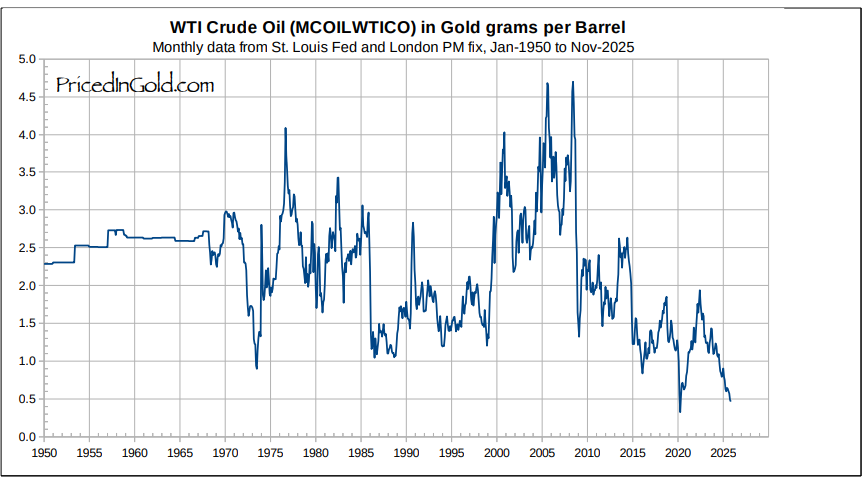
The Gold:Oil Ratio is a direct comparison of the price of one oz of gold in oil barrels. It is a great general reference point for sentiment in regards to growth vs capital preservation.
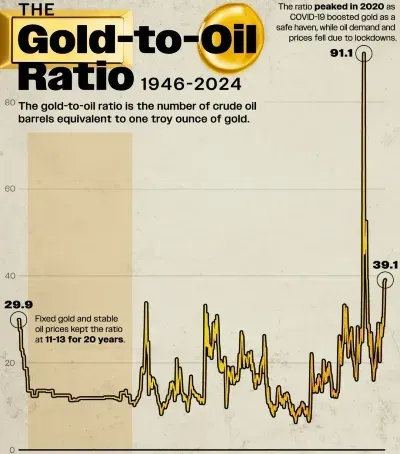
The ratio has generally stayed between the range of 10 and 35. Over the past 80 years it has made sense to position for reversal whenever the ratio reaches the upper or lower extremes of that range.
Covid Blowout
In 2020, the ratio did not just reach the extremes of the range, but completely blew out the normal range. Covid lockdowns hit the e-brake on oil consumption. The large commodity clearing houses such as the COMEX, were paying to put already produced oil into storage. Inventories exploded, a lot of oil ended up in storage on tankers. Producers shut in production. Savvy traders, refiners and others with access to oil storage were rewarded for storing oil until prices were back in a normal range.
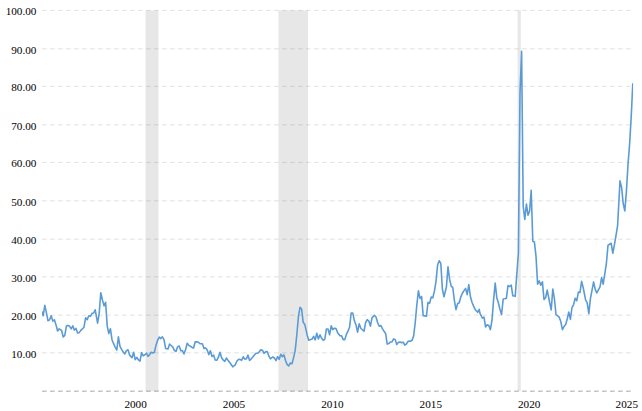
The ratio peaked at 91, the oil price in USD was negative. Lockdowns did not last very long, within weeks consumption resumed. Oil prices were back at $40. And the ratio came back down to 45 for the rest of 2020. And 2021 saw the ratio back within normal its trading range.
Recent Breakout
Fast forward to mid 2024, and the ratio again broke out of the trading range. This time due to a combination of deteriorating oil supply and demand fundamentals, as well as sovereign debt issues and strong central bank gold purchases. One of the main structural drivers of the gold price is sovereign diversification away from USTs.
The preference on this site is to price in gold weight, and think in gold weight. Meaning the proper way to look at this ratio is oil:gold, the inverse of the above chart.
Potential Triggers
Whenever the there has been an aggressive move in the gold to oil relationship, it has typically corrected via v-shape recovery. That implies gold priced in dollars must come down, or oil get much more expensive. The former would indicate a deflationary correction, meaning a gold, stock, and real estate market correction. While the latter would indicate oil catching up with the melt up that we are seeing in many commodities.
Usually these setups aren't an either or scenario, usually the resolution is a hybrid path. This would involve elements of correction, which we are seeing in real estate, SP5, and gold. And elements of oil prices bottoming with fundamentals firming up. The structural drivers here are under-investment in the industry coupled with high shale decline rates. Plus rising Asian demand.
The only thing missing is the trigger that would cause the v-shape recovery in the ratio. V-shape implies an aggressive change in trend. In the oil markets that typically has to be something that affects consumption, such as Covid lockdowns. Or something that affects production, such as a major disruption in a major oil producing region.
An increase in the blockade of Venezuelan oil exports could trigger this correction. My best guess is that this is the most likely scenario. Coupled with underwhelming shale response, OPEC out of spare capacity, and strong China & Indian oil demand.
Positioning
My general view coming out of 2025 is that this ratio is so out of whack that even Luke Gromen of FFT is calling for this ratio to continue to widen to +100.
Rob Connors of The Crude Chronicles uses the cost to produce the marginal barrel as the long term metric for the price of oil. That cost is in the $55-60 range which is where oil has been trading at the end of 2025, which implies relatively low downside risk from the current oil price.
The right action based on this perspective is to be positioned in oil producers. There is limited downside given oil price is relatively near or below cost of marginal production. Gold and markets generally need a break, and the gold-oil ratio is asking for a sharp recovery.